
Pharmaceutical and Biotechnology Patent Numbers are Declining
Assuming that patents represent innovation, it is troubling to observe the steady drop in patents filed worldwide for pharmaceuticals from 2006 through 2010. Biotechnology patents experienced a slight upwards movement:
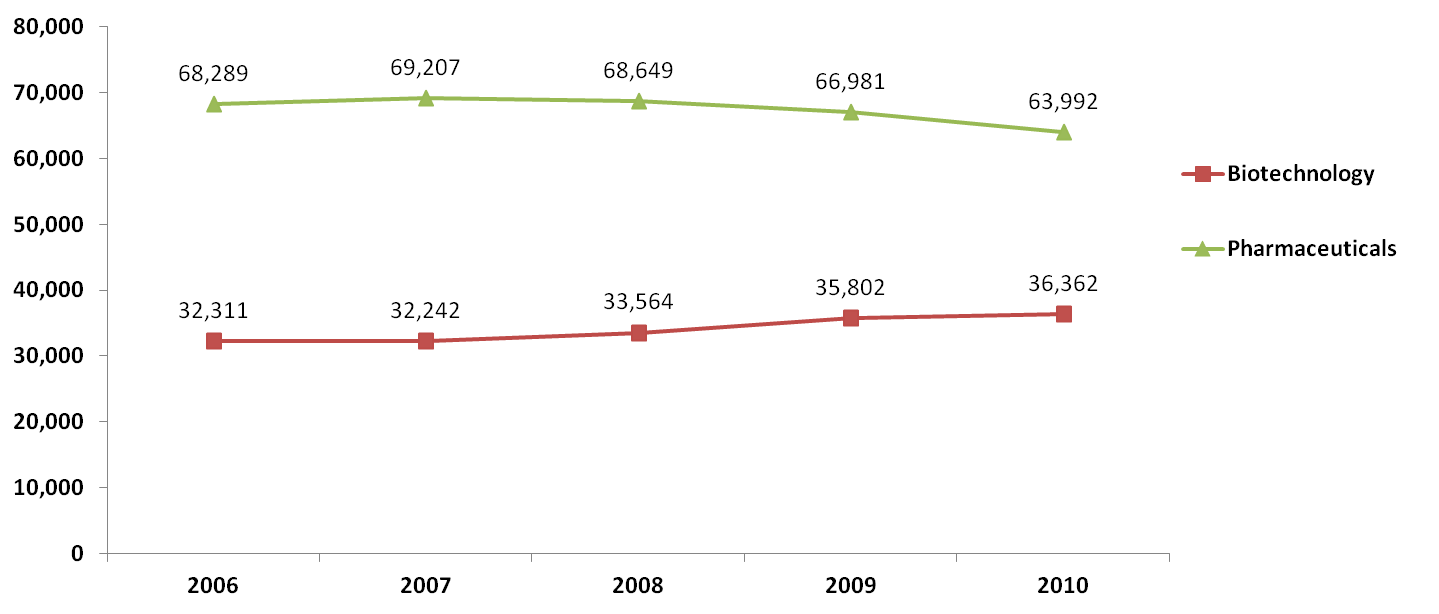
This is especially concerning in light of the recent patent cliff experienced by many of the major pharma players. I would have thought that given the decline in the number of patent-protected products and their sales, that big pharma would have been filing patents left and right to ensure protection of future innovation. Unfortunately, it appears that down-sizing was easier than innovating. Down-sizing may help in the short-term with managing Wall Street expectations, but without new and innovative products, future revenue will decline.
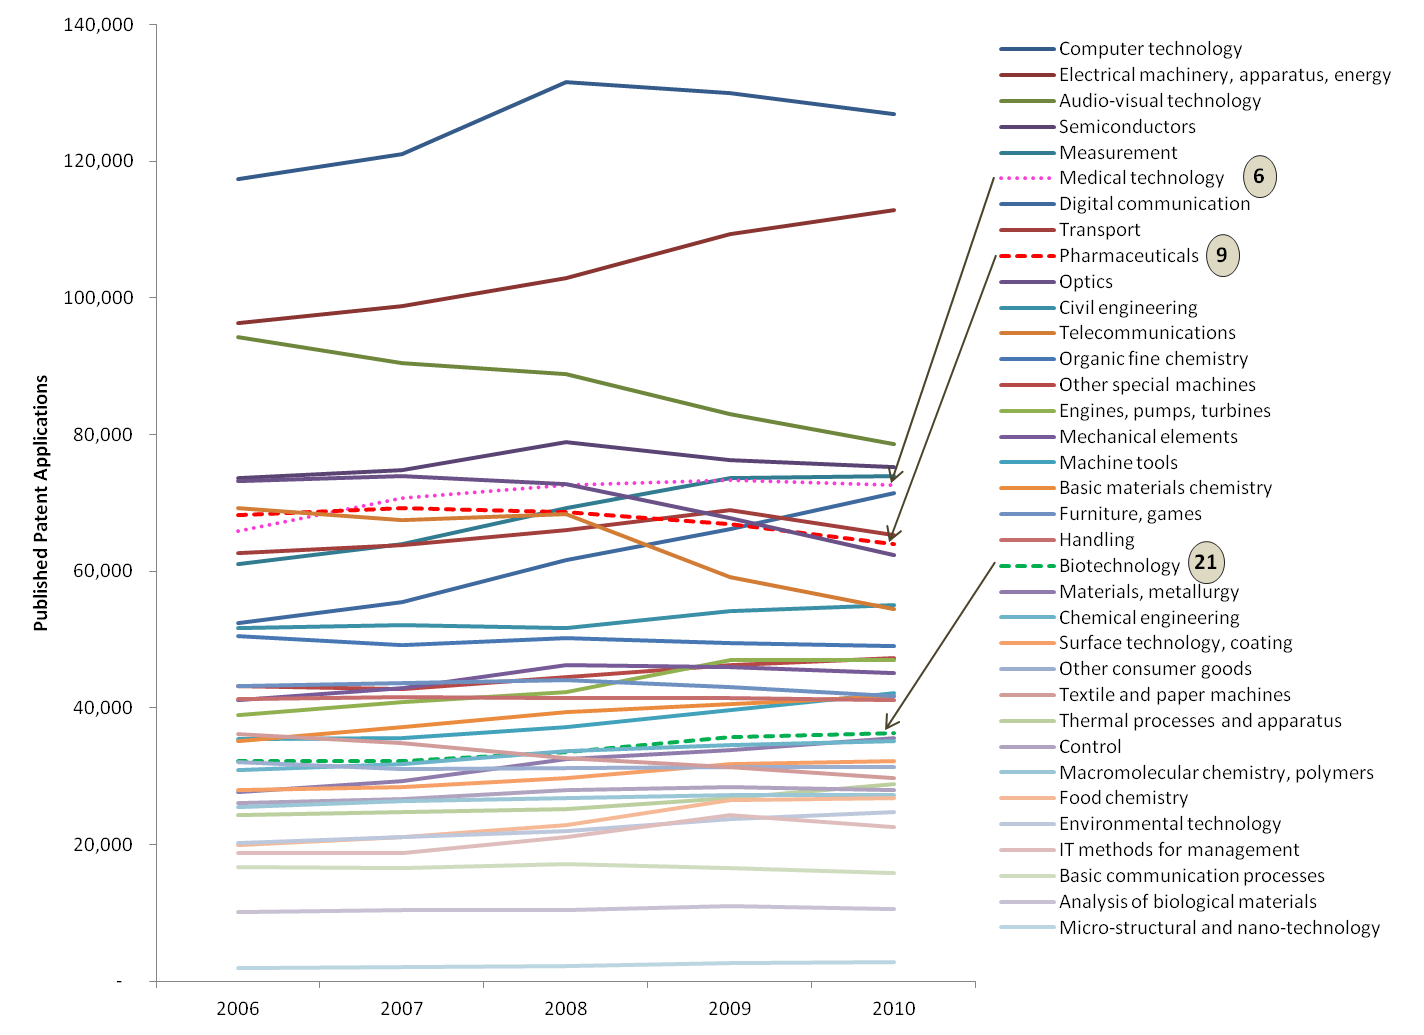
Life Science Patents vs. Other Industries
Not that I begrudge the world improved computer technologies or automobiles but I hope that health is valued higher than any other technology area. However, this appears not to be the case. In “World Intellectual Property Indicators – 2012 Edition” from the World Intellectual Property Organization (WIPO), data show that for patents submitted in 2010, medical devices rank 6th, pharmaceuticals are ranked 9th , and biotechnology is 21st. Digital communication technologies saw the highest average annual growth rates (+8.1%) between 2006 and 2010, while pharmaceutical filings have declined continuously since 2007.
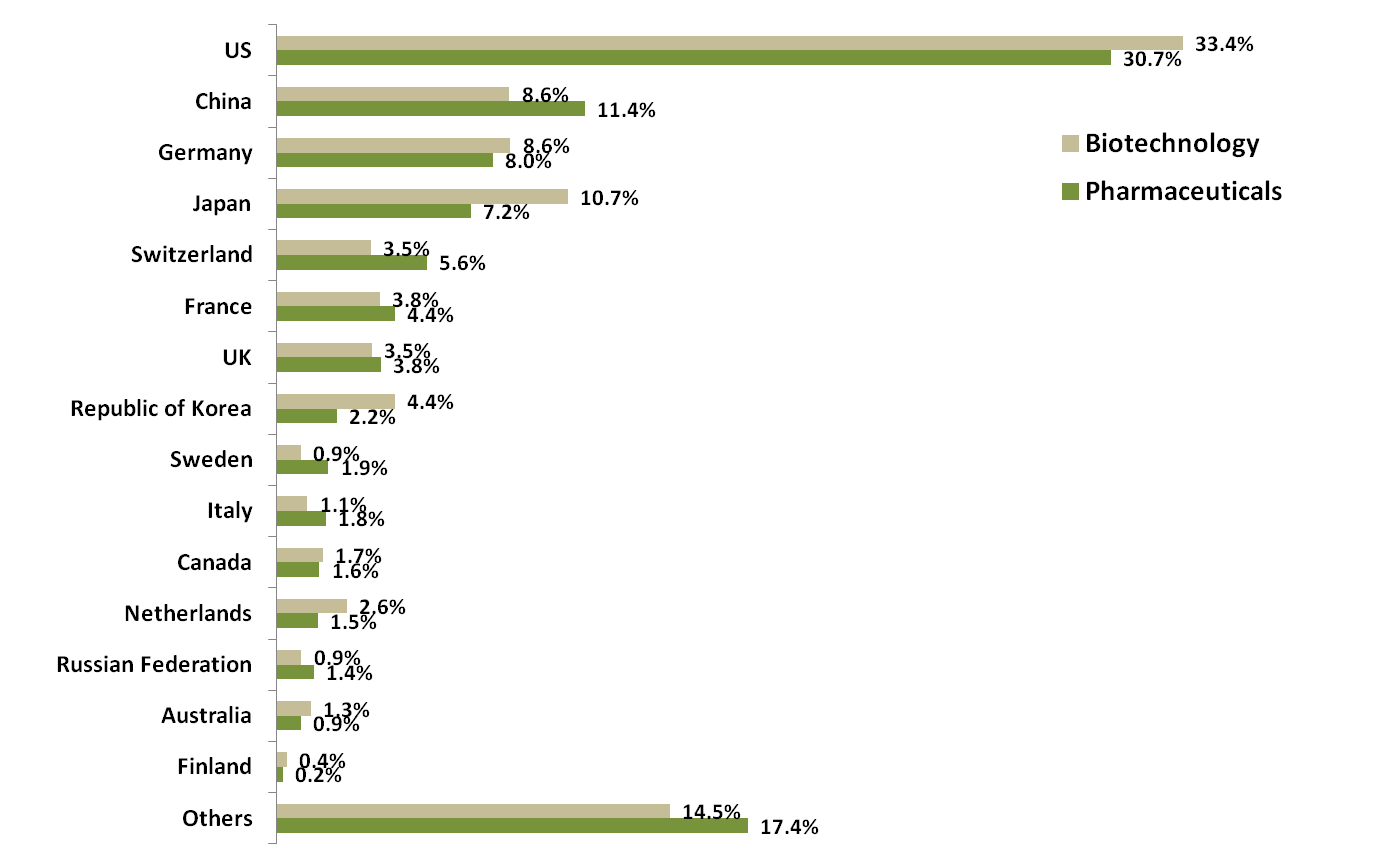
From 2006-2010, the US was responsible for approximately a third of biotechnology and pharmaceuticals patent applications filed globally. The US was followed by China, Germany, and Japan, each with about 8% share of patent applications.
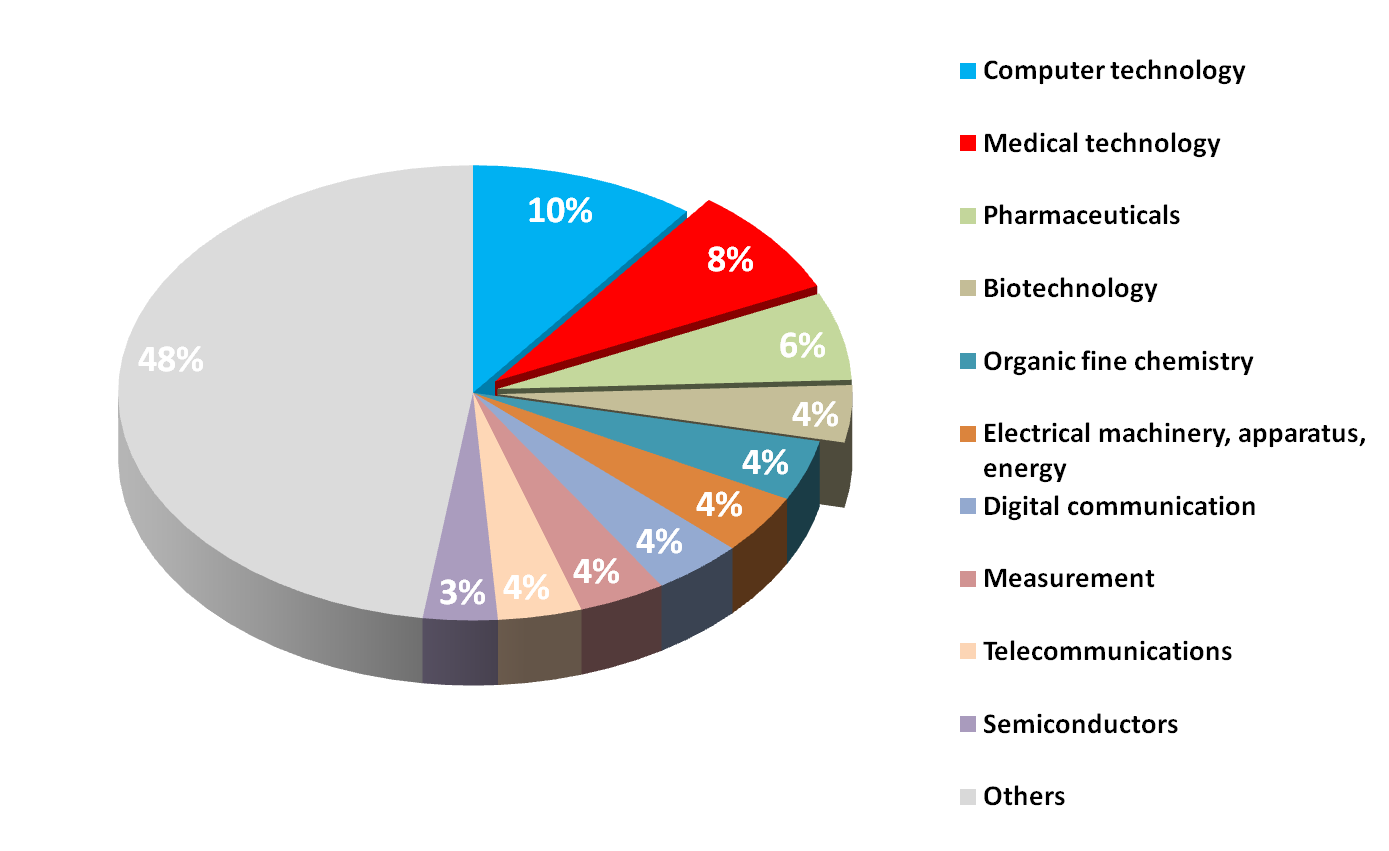
Life Science Patents in the US
For the US, patents related to life sciences (medical technology, pharmaceuticals, and biotechnology) are the second through the fourth most submitted.
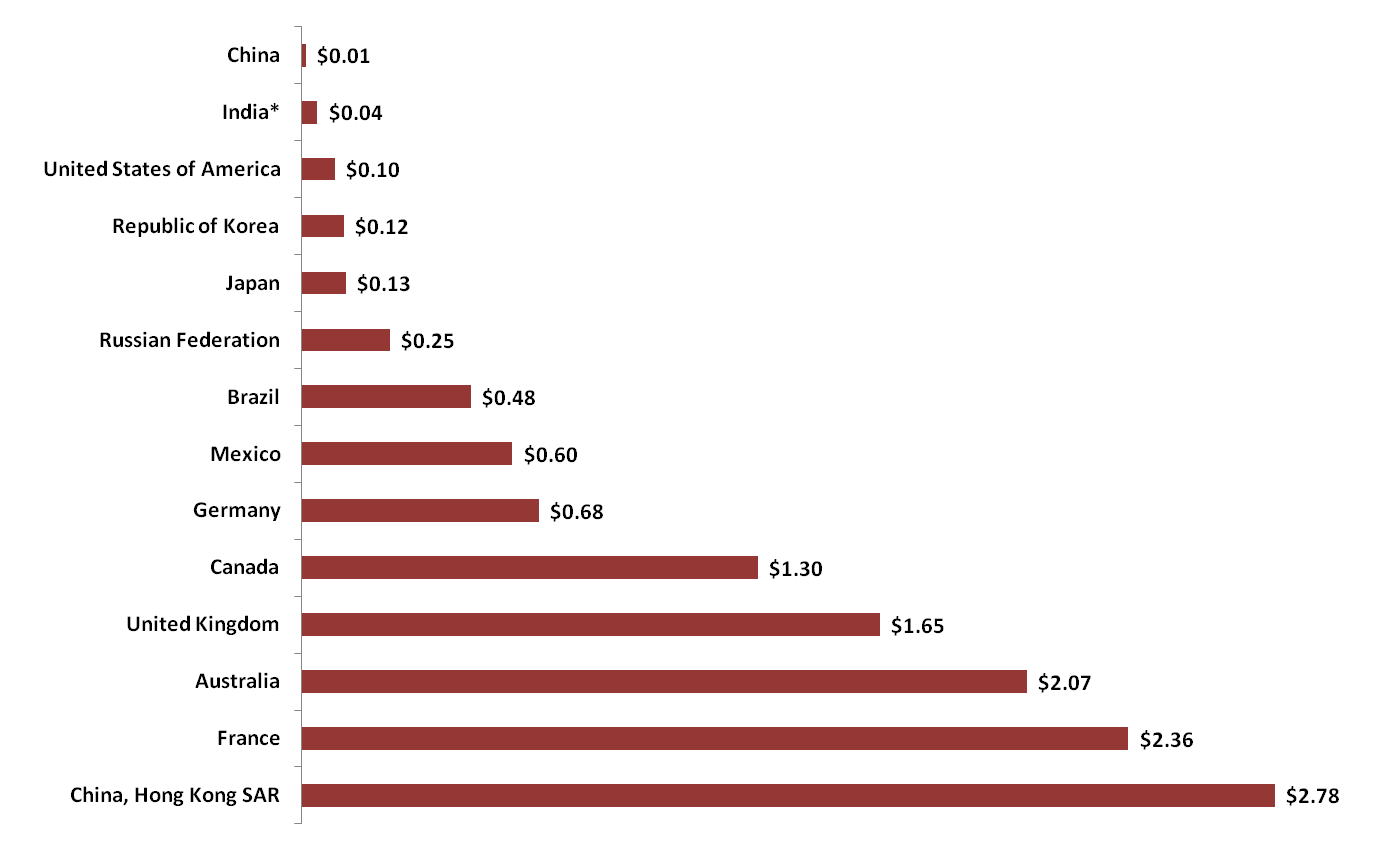
Calculating a Country’s Patent Efficiency
An interesting calculation I performed: I divided the gross domestic product (GDP) per capita of countries by the number of patents they have filed (for 2010). It is a very rough estimate of the efficiency of a country in translating investment (catch all term for education, enabling innovation infrastructure, spirit, etc…) into future value. What is interesting is the magnitude of variability in the calculated value between various nations. It is remarkable that China with its large population is able to produce a patent for approximately 1 US cent of GDP per capita.
A more informative calculation might be to divide the market value generated by the patents filed by the filing country’s population as this would provide some insight into the value contribution of a country’s populace to the world’s economy.
Leave a Reply
You must be logged in to post a comment.