It has been a rather hectic January and February 2014!

In short, I have been involved with:

  1. Serving my existing clients
  2. Creation of a crowdfunding business for life sciences (more to come on this later)
  3. Serving as a mentor on a team in the National Science Foundation-funded NYCRIN I-Corps

What is NYCRIN I-Corps?

The NYCRIN site provides the following description: “The New York City Regional Innovation Node (NYCRIN) is a network of 25 leading universities in the New York, New Jersey, Connecticut, and Pennsylvania area. NYCRIN unites, empowers and makes sustainable the unique innovation and entrepreneurial ecosystem in NYC and surrounding region.”
The I-Corps stands for Innovation Corps; NYCRIN I-Corps is a program that prepares academic researchers to become entrepreneurs and speeds the commercialization of their research.

What does an I-Corps Mentor do?

Mentors are responsible for guiding the team forward and reporting on its progress through regular communication with the cognizant NSF I-Corps program director. I serve essentially as a business/commercialization advisor for the project.

So far, I have had a great time. Participating in this has reminded me of the core issues related to commercialization and marketing. Serving the needs of customers is the fundamental driving force and not the product: it is much easier to sell heaters than ice to those at the North Pole!

Tagged with: , , , ,

With all of the recent energy being spent on discussing the implementation of the health insurance portion of the Affordable Care Act (called Obamacare by some people), I wondered  if there was any correlation between countries with universal health care (UHC) and those without UHC (like the United States) and how healthy the populations were in each group.

The Organisation for Economic Co-operation and Development (OECD) is composed of 34 member countries that “turn to one another to identify problems, discuss and analyze them, and promote policies to solve them”. Of these 34 countries, only five countries have less than 95% of healthcare paid by government/social health insurance: Chile (76% paid by government/social health insurance), Estonia (93%), Germany (89%), Mexico (87%), and the US (32%).

Spending versus Life Expectancy

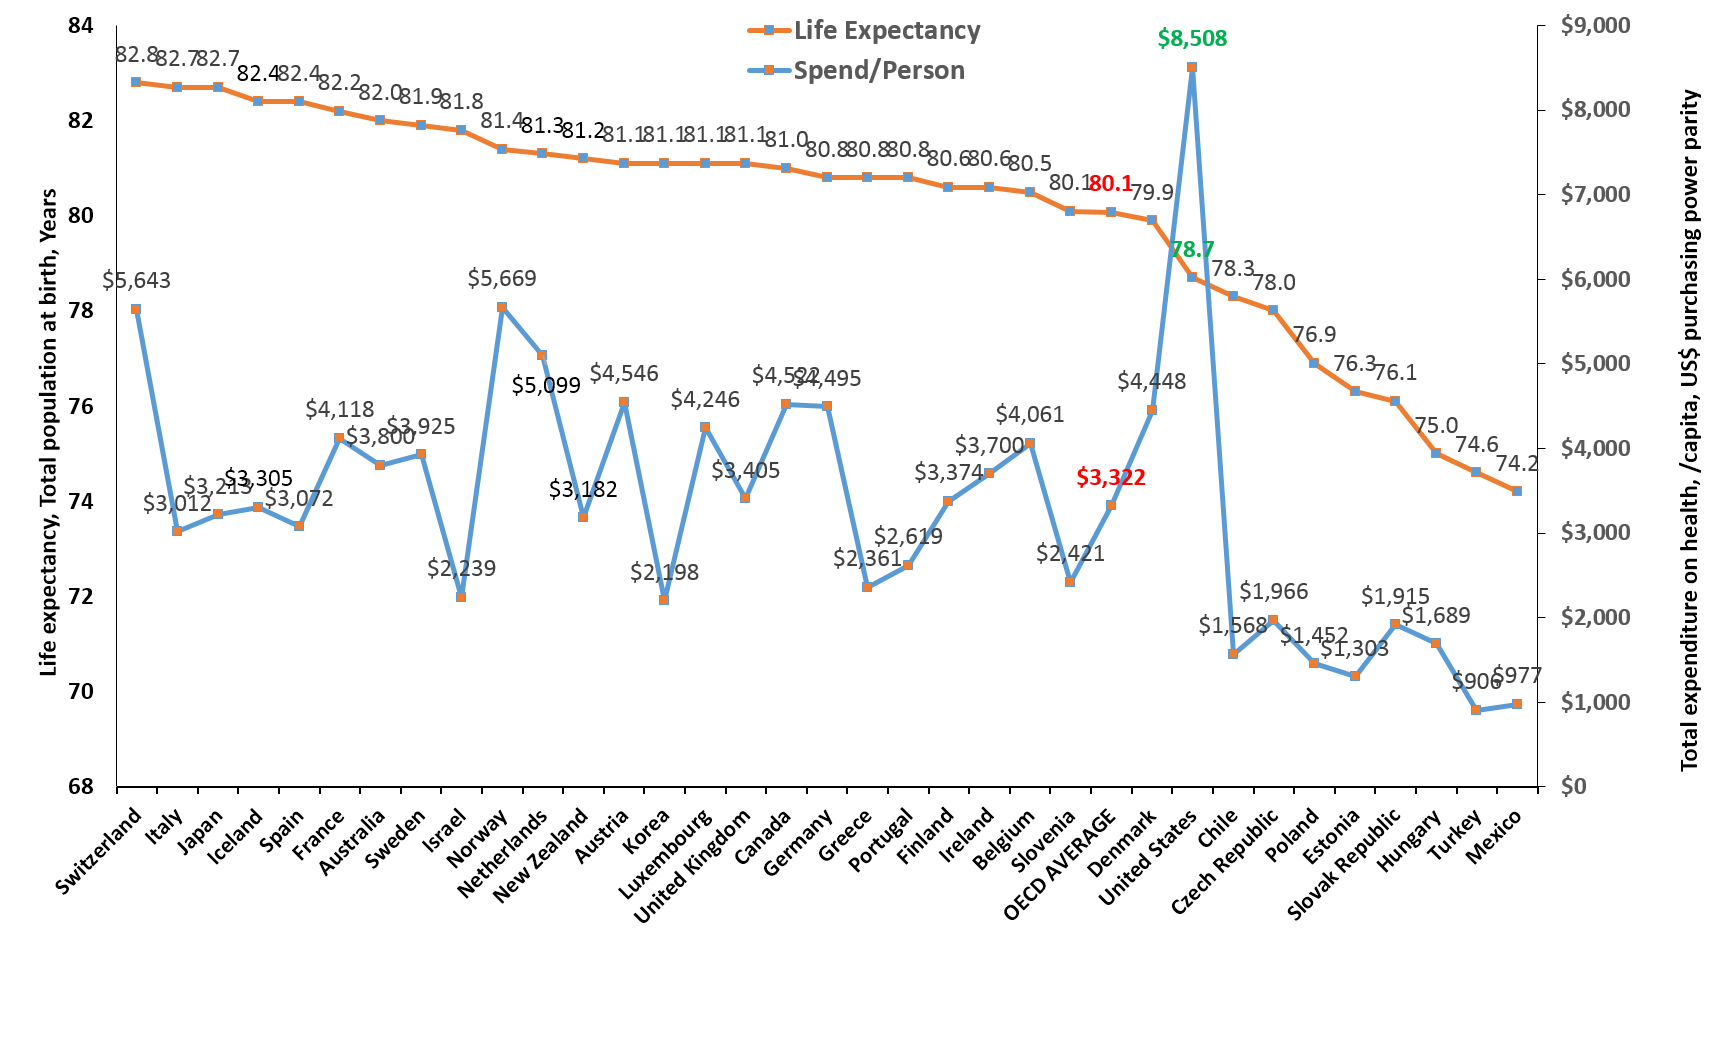
One way to examine the effect of UHC on health is to review and compare healthcare statistics. One such obvious metric is life expectancy.  The trouble with this endpoint is that there are many confounding forces on life expectancy beyond how healthcare is financed and delivered , e.g., diet, use of alcohol and/or tobacco products, level of activity, genetics, etc, but it is a place to start. Figure 1 shows the life expectancy at birth versus the percentage of gross domestic product (GDP) spent on healthcare.

Chart of Life Expectancy vs. % of GDP Spent on Healthcare

Figure 1. Life Expectancy vs. % of GDP Spent on Healthcare

As seen in the graphic, data for the OECD countries show that the life expectancy in the United States of 78.7 years is below the OECD average of 80.1. What is more remarkable is that the healthcare spend per person in the US is $8,508 versus the OECD average of $3,322. Healthcare spending per person in the US is more than 2.5 times that of the OECD average!

Healthcare Spending versus Infant Mortality

Perhaps there is another health measure that will provide evidence that the higher level of spending in the US system provides a superior healthcare result. Nothing could be as important to a society as the health of newborns. Looking at infant mortality statistics for the OECD reveals that the US’ higher spending has not resulted in superior infant mortality statistics as shown in Figure 2.

Chart of Infant Mortality vs. Healthcare Spending Per Person

The data indicate that in spite of the highest level of spending on health, the US has the fourth highest infant mortality rates among the OECD countries; definitely not a result indicating excellence in delivering healthcare.

Spending and Medical Devices

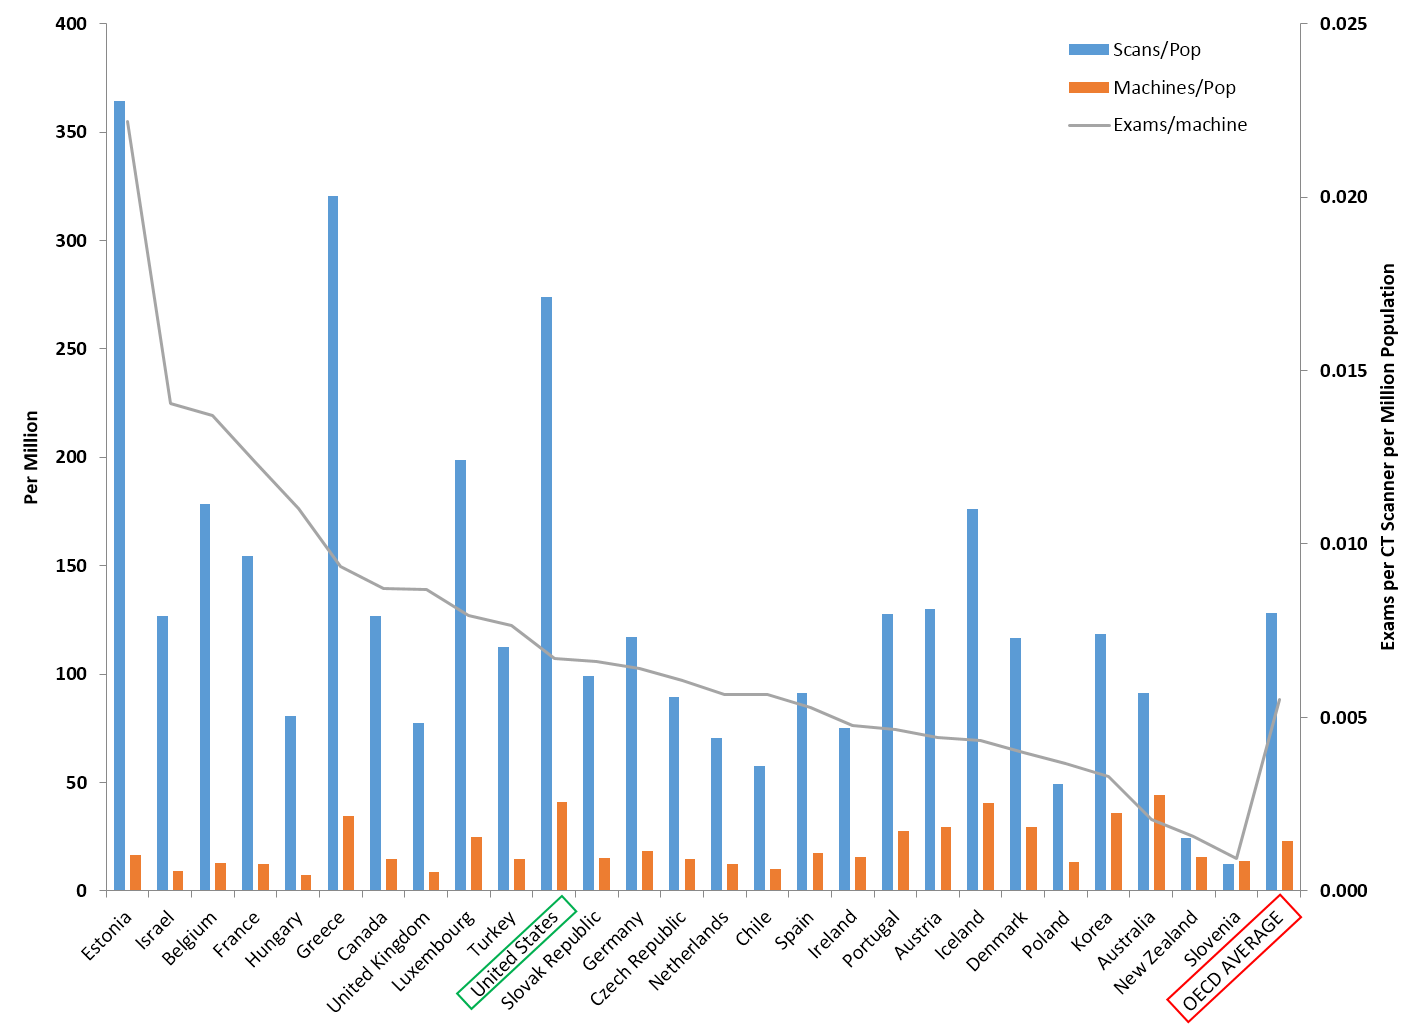
How does spending on capital equipment in the US compare to the OECD countries? Looking at the number of computed tomography exams, per million population vs. total number of computed tomography scanners per million population vs. the number of exams/machine (as a rough measure of health budget efficiency, the more exams done per machine should be more fiscally efficient) shows the US about mid-pack (data were not available for all OECD countries) :

A chart showing Relationships between CAT Scans, Machines, and Population

Figure 3. Relationships between CAT Scans, Machines, and Population

Stay the Course or Change?

These kinds of statistical manipulations and reviews can be performed endlessly to examine the performance of health care systems. What is clear is that the historical US health care system did not provide the best health care in the world as shown by only these few comparisons. Whether the future system in the US will perform better is certainly open to debate. I am willing to cast off the old system and embrace a system with a more universal care approach. Fingers crossed as we move forward!

Tagged with: , , , , ,

What is medication nonadherence?

According to a report from the Council for Affordable Health Coverage, medication adherence is “when a patient takes their medications according to the specific dosage, time, and frequency prescribed. A breakdown in any one of these elements (nonadherence) has the potential to result in unanticipated side effects and complications. Despite this:

  • Half of all patients do not take their medications as prescribed
  • 20% of all new prescriptions go unfilled
  • Adherence is lowest among patients with chronic illnesses”

What are the effects of nonadherence?

IMS Healthcare’s 2013 report “Avoidable Costs in U.S. Healthcare” states that, at minimum, nonadherence is responsible for $105.4 billion of avoidable healthcare costs in the US (3.9% of the $2.7 trillion spent on healthcare in 2012).
The Council for Affordable Health Coverage claims that nonadherence is responsible for:

  • 125,000 Americans die annually (89,000 with hypertension) due to poor medication adherence.
  • Patients who take medications as prescribed may save as much as $7,800 per patient annually.
  • As adherence declines, emergency room visits increase by 17% and hospital stays rise 10% among patients with diabetes, asthma, or gastric acid disorder.
  • Poor medication adherence results in 33 to 69% of medication-related hospital admissions in the United States, at a cost of roughly $100 billion per year.
  • The New England Healthcare Institute estimates that total potential savings from adherence and related disease management could be $290 billion annually—13% of health spending.

What issues are related to nonadherence?

In “Primary Medication Non-Adherence: Analysis of 195,930 Electronic Prescriptions“, an article by Voleli et al in 2009, a review of e-prescriptions for over 75,000 patients was performed to examine which of various characteristics were associated with nonadherence.
The key results of their multivariate analysis for all medications:

Results of Multivariate Models: Impact of Medication, Clinician, and Patient Characteristics on Primary Adherence to E- Prescriptions; Patients Aged 19+

The analysis indicates that certain characteristics are related to higher and lower adherence rates. For example, what may be seen in the chart is that dermatologic agents are associated with a higher degree of nonadherence than asthma drugs: an odds ratio of 0.53 vs. asthma medicines’ 1.02 OR (antimicrobials were the referent, OR of 1.0). Another example is a lower OR for prescription adherence for those written by female versus male physicians.

What can be done to reduce nonadherence?

A July 2013 report, “Thinking Outside the Pillbox: Six Priorities for Action to Support Improved Patient Medication Adherence“, from The New England Healthcare Institute (NEHI), recommends actions be taken within the following six broad themes:

  1. “Promote sharing of best practices and lessons learned from pilots of new medication management techniques
  2. Support large-scale implementation of promising, evidence-based “tactics” for improved medication management
  3. Continue development of metrics of medication use that will spur adoption of proven medication management strategies
  4. Support continued rapid adoption of electronic prescribing and electronic medical records with capabilities that support evidence-based interventions for improved adherence
  5. Continue to improve Medication Therapy Management services in Medicare Part D including improvements in program services and targeting; consider wider adoption of medication management by other health care payers
  6. Integrate medication adherence research, policy development and advocacy with broader efforts that aim to improve use of medicines, including those focused on patient safety.”
Tagged with: , , , , , ,
%d bloggers like this: